REGBorneo_YearOfEstablishmentIOPP_1973to2016_CIFOR (Map Service)
View In: ArcGIS JavaScript ArcGIS.com WMTS
Current Version: 10.81
Service Description:
Year of establishment industrial oil palm plantation
|
Areas(in Ha) |
Borneo |
Kalimantan |
Sabah |
Sarawak |
Brunei |
|
Total land area |
73,719,011 |
53,342,225 |
7,396,621 |
12,400,501 |
579,664 |
|
Area of oil palm plantations in 1973 |
135,840 |
0 |
131,078 |
4,762 |
0 |
|
Plantation expansion: |
|||||
|
1973-1990 |
836,150 |
164,280 |
567,128 |
104,742 |
0 |
|
1990-1995 |
783,047 |
392,718 |
267,353 |
122,767 |
209 |
|
1995-2000 |
1,206,395 |
544,569 |
336,272 |
324,920 |
634 |
|
2000-2005 |
732,268 |
432,174 |
110,566 |
189,527 |
1 |
|
2005-2010 |
2,321,989 |
1,739,733 |
87,752 |
494,344 |
160 |
|
2010-2015 |
2,199,153 |
1,684,723 |
106,204 |
408,190 |
36 |
|
2016 |
132,991 |
103,373 |
7,789 |
21,829 |
0 |
|
Total expansion (1973–2016) |
8,211,979 |
5,061,570 |
1,483,064 |
1,666,319 |
1040 |
|
Total area of plantations in 2016 |
8,347,833 |
5,061,571 |
1,614,142 |
1,671,081 |
1040 |
Methods
We digitized the expansion of areas developed (or under development) by oil palm companies (hereafter called ‘industrial oil palm plantations’) in approximately five-year increments over six consecutive periods between 1972and 2015 using a time-series of 434 LANDSAT images arranged in sequence in circa 1973, 1990, 1995, 2000, 2005, 2010, 2015 and LANDSAT cloud free imagery extracted from Google Earth Engine for year 2016.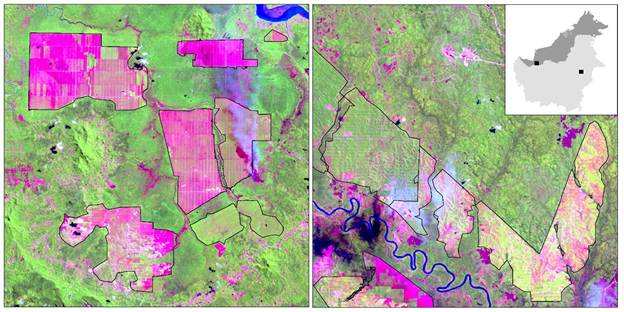
Figure 1│ Close-up view (scale 1:100,000) of an area in Sarawak, Malaysian Borneo (Left Panel) and an area in East Kalimantan, Indonesian Borneo (Right Panel) (See top-right inset for locations). On these LANDSAT 5 image snapshots acquired in year 2009 (false color composite: 5-4-3), industrial oil-palm plantations are easily recognized by their geometric shapes (rectangular-like shapes or otherwise more complex shapes with linear boundaries), their distinctive grid-like or contour-like patterns and by their homogeneous spectral colors characteristic of either young open-canopy (yellow), mature closed-canopy (green) single tree-species plantations, or recently-cleared lands devoid of vegetation (pink).
These spatial patterns are easily detected by the human eye, but are difficult to capture with computer codes. Therefore, we delineated the boundaries of industrial plantations using a visual, expert-based interpretation method. We also employed maps of oil-palm and pulpwood concessions that have entered the public sphere to distinguish young oil-palm from young pulpwood plantations because similar planting patterns and spectral colors are seen in both plantation types. In the process, we also generated the expanding area of pulpwood plantations. We note, that concession maps were not always a reliable indicator of plantations locations. Particularly for Indonesia, the oil-palm industry often develops plantations outside of concession boundaries including inside pulpwood concessions. The opposite is not true because pulpwood plantations are better regulated. A total of 1,705 and 366 polygons (> 90 ha) developed by oil-palm and pulpwood companies, respectively, each with an associated year of development, were digitized in ArcGIS 10.2.2, by just two experts working together, in the same office, to ensure consistency.
Second, we corrected the Developed-by-Company polygons to remove any obvious errors resulting from visual interpretation. Small remnants of remaining forests or small patches of undeveloped clearings (for example, openings in the forest by small-holders, or logging tracts) were counted as Developed-by-Company during visual interpretation. It is often too time-consuming to digitize small elements manually, but these small elements were detected by the computer codes used to generate the Deforestation map. We refined the shape (and size) of the Developed-by-Company polygons by intersecting them with the Deforestation map, which reveal these discrepancies between both datasets. For example, if an area was Forest in 2015 according to the Deforestation map, and Developed-by-Company according to the visual interpretation, the area was recoded as Forest (see example in Figure 2).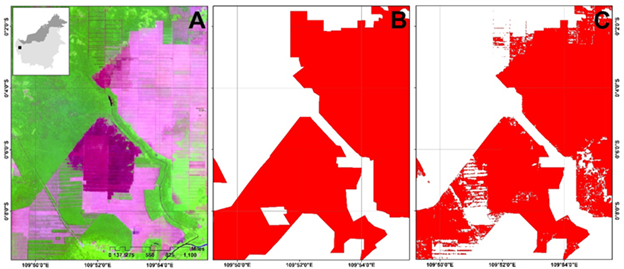
Figure 2│ Examples of industrial oil-palm plantation extent (A, B, C) before (A, B) and after (C) applying a correction procedure described in Methods.
Conversely, if an area was Cleared according to the Deforestation map, and Forest according to visual interpretation, we determined the correct land cover type (whether Cleared, or Developed) by reviewing our database of LANDSAT imagery and, in some cases high-resolution imagery on Google Earth. The same procedure was repeated for previous years. This correction procedure ensured total consistency between the Borneo-wide Deforestation map and the map showing the expansion of areas developed by companies.
Map Name: Layers
Legend
All Layers and Tables
Layers: Tables:
Year of establishment industrial oil palm plantation
|
Areas(in Ha) |
Borneo |
Kalimantan |
Sabah |
Sarawak |
Brunei |
|
Total land area |
73,719,011 |
53,342,225 |
7,396,621 |
12,400,501 |
579,664 |
|
Area of oil palm plantations in 1973 |
135,840 |
0 |
131,078 |
4,762 |
0 |
|
Plantation expansion: |
|||||
|
1973-1990 |
836,150 |
164,280 |
567,128 |
104,742 |
0 |
|
1990-1995 |
783,047 |
392,718 |
267,353 |
122,767 |
209 |
|
1995-2000 |
1,206,395 |
544,569 |
336,272 |
324,920 |
634 |
|
2000-2005 |
732,268 |
432,174 |
110,566 |
189,527 |
1 |
|
2005-2010 |
2,321,989 |
1,739,733 |
87,752 |
494,344 |
160 |
|
2010-2015 |
2,199,153 |
1,684,723 |
106,204 |
408,190 |
36 |
|
2016 |
132,991 |
103,373 |
7,789 |
21,829 |
0 |
|
Total expansion (1973–2016) |
8,211,979 |
5,061,570 |
1,483,064 |
1,666,319 |
1040 |
|
Total area of plantations in 2016 |
8,347,833 |
5,061,571 |
1,614,142 |
1,671,081 |
1040 |
Methods
We digitized the expansion of areas developed (or under development) by oil palm companies (hereafter called ‘industrial oil palm plantations’) in approximately five-year increments over six consecutive periods between 1972and 2015 using a time-series of 434 LANDSAT images arranged in sequence in circa 1973, 1990, 1995, 2000, 2005, 2010, 2015 and LANDSAT cloud free imagery extracted from Google Earth Engine for year 2016.
Figure 1│ Close-up view (scale 1:100,000) of an area in Sarawak, Malaysian Borneo (Left Panel) and an area in East Kalimantan, Indonesian Borneo (Right Panel) (See top-right inset for locations). On these LANDSAT 5 image snapshots acquired in year 2009 (false color composite: 5-4-3), industrial oil-palm plantations are easily recognized by their geometric shapes (rectangular-like shapes or otherwise more complex shapes with linear boundaries), their distinctive grid-like or contour-like patterns and by their homogeneous spectral colors characteristic of either young open-canopy (yellow), mature closed-canopy (green) single tree-species plantations, or recently-cleared lands devoid of vegetation (pink).
These spatial patterns are easily detected by the human eye, but are difficult to capture with computer codes. Therefore, we delineated the boundaries of industrial plantations using a visual, expert-based interpretation method. We also employed maps of oil-palm and pulpwood concessions that have entered the public sphere to distinguish young oil-palm from young pulpwood plantations because similar planting patterns and spectral colors are seen in both plantation types. In the process, we also generated the expanding area of pulpwood plantations. We note, that concession maps were not always a reliable indicator of plantations locations. Particularly for Indonesia, the oil-palm industry often develops plantations outside of concession boundaries including inside pulpwood concessions. The opposite is not true because pulpwood plantations are better regulated. A total of 1,705 and 366 polygons (> 90 ha) developed by oil-palm and pulpwood companies, respectively, each with an associated year of development, were digitized in ArcGIS 10.2.2, by just two experts working together, in the same office, to ensure consistency.
Second, we corrected the Developed-by-Company polygons to remove any obvious errors resulting from visual interpretation. Small remnants of remaining forests or small patches of undeveloped clearings (for example, openings in the forest by small-holders, or logging tracts) were counted as Developed-by-Company during visual interpretation. It is often too time-consuming to digitize small elements manually, but these small elements were detected by the computer codes used to generate the Deforestation map. We refined the shape (and size) of the Developed-by-Company polygons by intersecting them with the Deforestation map, which reveal these discrepancies between both datasets. For example, if an area was Forest in 2015 according to the Deforestation map, and Developed-by-Company according to the visual interpretation, the area was recoded as Forest (see example in Figure 2).
Figure 2│ Examples of industrial oil-palm plantation extent (A, B, C) before (A, B) and after (C) applying a correction procedure described in Methods.
Conversely, if an area was Cleared according to the Deforestation map, and Forest according to visual interpretation, we determined the correct land cover type (whether Cleared, or Developed) by reviewing our database of LANDSAT imagery and, in some cases high-resolution imagery on Google Earth. The same procedure was repeated for previous years. This correction procedure ensured total consistency between the Borneo-wide Deforestation map and the map showing the expansion of areas developed by companies.
Copyright Text: CIFOR
Spatial Reference:
102100
Single Fused Map Cache: true
Capabilities: Map,TilesOnly
Tile Info:
- Height: 256
- Width: 256
- DPI: 96
- Levels of Detail: (# Levels: 14)
- Level ID: 0 [Start Tile, End Tile]
- Resolution: 156543.033928
Scale: 5.91657527591555E8 - Level ID: 1 [Start Tile, End Tile]
- Resolution: 78271.5169639999
Scale: 2.95828763795777E8 - Level ID: 2 [Start Tile, End Tile]
- Resolution: 39135.7584820001
Scale: 1.47914381897889E8 - Level ID: 3 [Start Tile, End Tile]
- Resolution: 19567.8792409999
Scale: 7.3957190948944E7 - Level ID: 4 [Start Tile, End Tile]
- Resolution: 9783.93962049996
Scale: 3.6978595474472E7 - Level ID: 5 [Start Tile, End Tile]
- Resolution: 4891.96981024998
Scale: 1.8489297737236E7 - Level ID: 6 [Start Tile, End Tile]
- Resolution: 2445.98490512499
Scale: 9244648.868618 - Level ID: 7 [Start Tile, End Tile]
- Resolution: 1222.99245256249
Scale: 4622324.434309 - Level ID: 8 [Start Tile, End Tile]
- Resolution: 611.49622628138
Scale: 2311162.217155 - Level ID: 9 [Start Tile, End Tile]
- Resolution: 305.748113140558
Scale: 1155581.108577 - Level ID: 10 [Start Tile, End Tile]
- Resolution: 152.874056570411
Scale: 577790.554289 - Level ID: 11 [Start Tile, End Tile]
- Resolution: 76.4370282850732
Scale: 288895.277144 - Level ID: 12 [Start Tile, End Tile]
- Resolution: 38.2185141425366
Scale: 144447.638572 - Level ID: 13 [Start Tile, End Tile]
- Resolution: 19.1092570712683
Scale: 72223.819286 - Format: PNG
- Compression Quality: 0
- Origin:
- X: -2.0037508342787E7
Y: 2.0037508342787E7
- Spatial Reference:
102100
- XMin: 1.1728136862900784E7
YMin: -519305.8960877207
XMax: 1.3664989523887744E7
YMax: 844029.0502665583
Spatial Reference:
102100
- XMin: 1.211186300286221E7
YMin: -457293.0019661765
XMax: 1.3277082331220841E7
YMax: 781701.0276345728
Spatial Reference:
102100
Max Scale: 72223.819286
Min LOD: 0
Max LOD: 13
Units: esriMeters
Supported Image Format Types: PNG
Export Tiles Allowed: false
Max Export Tiles Count: 100000
Document Info:
- Title: REGBorneo_YearOfEstablishmentIOPP_1973to2016_CIFOR
- Author: CIFOR_CSI
- Comments:
- Subject: Year of establishment of industrial oil-palm plantation
- Category:
- Keywords: established year, oilpalm, oil palm