bag_hillshades (Map Service)
View In: ArcGIS JavaScript ArcGIS.com WMTS
Current Version: 10.81
Service Description: This tile layer displays detailed color shaded relief visualizations of high-resolution quality-controlled seafloor elevation from NOAA National Ocean Service (NOS) Hydrographic Survey Bathymetric Attributed Grids (BAGs) in U.S. coastal waters. Many near-shore areas have been mapped at high resolution (often 1 meter or better). The depths are usually relative to Mean Lower Low Water (MLLW) datum.
BAG is a non-proprietary file format for storing and exchanging bathymetric data developed by the Open Navigation Surface Working Group. BAG files are gridded, multi-dimensional bathymetric data files and is the standard NOS hydrographic data file for public release. Current versions of the BAG file contain position and depth grid data, as well as position and uncertainty grid data, and the metadata specific to that BAG file, providing end users information about the source and contents of the BAG file. The corresponding NOS Hydrographic Surveys map service displays the locations and coverage of the hydrographic surveys as polygons, along with additional metadata and links to obtain the data.
This image service is available in 2 versions:
Seamless mosaic version (tile layer; overview of all surveys in a continuous image)
Note: this is a tiled image service, cached to zoom level 15 (~4.7 m resolution).
Subsets version (access to the underlying images; allows subsets using a definition query; maximum of 80 rasters displayed at a time)
See this service in a combined map with survey polygons.
Also see the corresponding Bathymetric Attributed Grid (BAG) Image Service, which provides depth values.
Note: the above screenshot is of NOS survey H11974, showing Mattole Canyon off of northern California.
The NCEI Bathymetric Data Viewer can be used to search and display these data. More information about NOS Hydrographic Survey data available at NCEI.
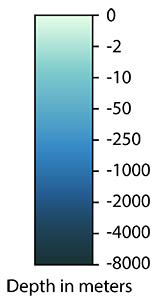
Below is the color scale used to represent depths (usually relative to Mean Lower Low Water):
Note: the above screenshot is of NOS survey H11974, showing Mattole Canyon off of northern California.
The NCEI Bathymetric Data Viewer can be used to search and display these data. More information about NOS Hydrographic Survey data available at NCEI.
Below is the color scale used to represent depths (usually relative to Mean Lower Low Water):
Last update: Nov. 8, 2024
Map Name: Layers
Legend
All Layers and Tables
Description: This tile layer displays detailed color shaded relief visualizations of high-resolution quality-controlled seafloor elevation from NOAA National Ocean Service (NOS) Hydrographic Survey Bathymetric Attributed Grids (BAGs) in U.S. coastal waters. Many near-shore areas have been mapped at high resolution (often 1 meter or better). The depths are usually relative to Mean Lower Low Water (MLLW) datum.
BAG is a non-proprietary file format for storing and exchanging bathymetric data developed by the Open Navigation Surface Working Group. BAG files are gridded, multi-dimensional bathymetric data files and is the standard NOS hydrographic data file for public release. Current versions of the BAG file contain position and depth grid data, as well as position and uncertainty grid data, and the metadata specific to that BAG file, providing end users information about the source and contents of the BAG file. The corresponding NOS Hydrographic Surveys map service displays the locations and coverage of the hydrographic surveys as polygons, along with additional metadata and links to obtain the data.
This image service is available in 2 versions:
Seamless mosaic version (tile layer; overview of all surveys in a continuous image)
Note: this is a tiled image service, cached to zoom level 15 (~4.7 m resolution).
Subsets version (access to the underlying images; allows subsets using a definition query; maximum of 80 rasters displayed at a time)
See this service in a combined map with survey polygons.
Also see the corresponding Bathymetric Attributed Grid (BAG) Image Service, which provides depth values.
Note: the above screenshot is of NOS survey H11974, showing Mattole Canyon off of northern California.
The NCEI Bathymetric Data Viewer can be used to search and display these data. More information about NOS Hydrographic Survey data available at NCEI.
Below is the color scale used to represent depths (usually relative to Mean Lower Low Water):
Last update: Nov. 8, 2024
Copyright Text: NOAA National Centers for Environmental Information (NCEI), National Ocean Service (NOS)
Spatial Reference:
102100
Single Fused Map Cache: true
Capabilities: Map,TilesOnly,Tilemap
Tile Info:
- Height: 256
- Width: 256
- DPI: 96
- Levels of Detail: (# Levels: 24)
- Level ID: 0 [Start Tile, End Tile]
- Resolution: 156543.033928
Scale: 5.91657527591555E8 - Level ID: 1 [Start Tile, End Tile]
- Resolution: 78271.5169639999
Scale: 2.95828763795777E8 - Level ID: 2 [Start Tile, End Tile]
- Resolution: 39135.7584820001
Scale: 1.47914381897889E8 - Level ID: 3 [Start Tile, End Tile]
- Resolution: 19567.8792409999
Scale: 7.3957190948944E7 - Level ID: 4 [Start Tile, End Tile]
- Resolution: 9783.93962049996
Scale: 3.6978595474472E7 - Level ID: 5 [Start Tile, End Tile]
- Resolution: 4891.96981024998
Scale: 1.8489297737236E7 - Level ID: 6 [Start Tile, End Tile]
- Resolution: 2445.98490512499
Scale: 9244648.868618 - Level ID: 7 [Start Tile, End Tile]
- Resolution: 1222.99245256249
Scale: 4622324.434309 - Level ID: 8 [Start Tile, End Tile]
- Resolution: 611.49622628138
Scale: 2311162.217155 - Level ID: 9 [Start Tile, End Tile]
- Resolution: 305.748113140558
Scale: 1155581.108577 - Level ID: 10 [Start Tile, End Tile]
- Resolution: 152.874056570411
Scale: 577790.554289 - Level ID: 11 [Start Tile, End Tile]
- Resolution: 76.4370282850732
Scale: 288895.277144 - Level ID: 12 [Start Tile, End Tile]
- Resolution: 38.2185141425366
Scale: 144447.638572 - Level ID: 13 [Start Tile, End Tile]
- Resolution: 19.1092570712683
Scale: 72223.819286 - Level ID: 14 [Start Tile, End Tile]
- Resolution: 9.55462853563415
Scale: 36111.909643 - Level ID: 15 [Start Tile, End Tile]
- Resolution: 4.77731426794937
Scale: 18055.954822 - Level ID: 16 [Start Tile, End Tile]
- Resolution: 2.38865713397468
Scale: 9027.977411 - Level ID: 17 [Start Tile, End Tile]
- Resolution: 1.19432856685505
Scale: 4513.988705 - Level ID: 18 [Start Tile, End Tile]
- Resolution: 0.597164283559817
Scale: 2256.994353 - Level ID: 19 [Start Tile, End Tile]
- Resolution: 0.298582141647617
Scale: 1128.497176 - Level ID: 20 [Start Tile, End Tile]
- Resolution: 0.14929107082380833
Scale: 564.248588 - Level ID: 21 [Start Tile, End Tile]
- Resolution: 0.07464553541190416
Scale: 282.124294 - Level ID: 22 [Start Tile, End Tile]
- Resolution: 0.03732276770595208
Scale: 141.062147 - Level ID: 23 [Start Tile, End Tile]
- Resolution: 0.01866138385297604
Scale: 70.5310735 - Format: MIXED
- Compression Quality: 90
- Origin:
- X: -2.0037508342787E7
Y: 2.0037508342787E7
- Spatial Reference:
102100
- XMin: -2.0037508342787E7
YMin: -1.9971868045805603E7
XMax: 2.0037508343847226E7
YMax: 1.997186804474538E7
Spatial Reference:
102100
- XMin: -2.0037508342787E7
YMin: -1.9971868045805603E7
XMax: 2.0037508343847226E7
YMax: 1.997186804474538E7
Spatial Reference:
102100
Max Scale: 18055.954822
Min LOD: 0
Max LOD: 15
Units: esriMeters
Supported Image Format Types: MIXED
Export Tiles Allowed: false
Max Export Tiles Count: 100000
Resampling: true
Document Info:
- Title: NCEI Bathymetric Attributed Grid (BAG) Mosaic Shaded Relief Visualization (tiled)
- Author: ncei_noaa
- Comments:
- Subject: Color shaded relief visualization of high-resolution quality-controlled seafloor elevation from NOAA National Ocean Service (NOS) Hydrographic Survey BAGs in U.S. coastal waters.
- Category:
- Keywords: NOAA, NCEI, NOS, NOS Hydro, BAG, hillshade, bathymetry, seafloor, Hydrographic Surveys, Hydrography, NOSHDB, HSMDB